

Polls
Let your audience vote from their phones and show the results on screen as they come in.
Overview
Section titled “Overview”Deckyard has three slide types for voting, all in the Interaction category:
| Slide type | What the audience does | Results on screen |
|---|---|---|
| Poll | Picks one of 2 to 4 answers | Bars with count and percentage per answer |
| Likert | Picks one point on a labelled scale of 2 to 10 points | A curve over the scale |
| Likert slider | Sets a slider from 1 to 10 | A curve over the scale |
Voting runs through follow mode: while your session is live, the audience scans the QR code or enters the join code, and votes on the slide you are showing.
Creating a Poll
Section titled “Creating a Poll”- Click Add slide
- Select Poll from the Interaction category
- Type your question
- Fill in the answers
- Choose what happens when you close the poll
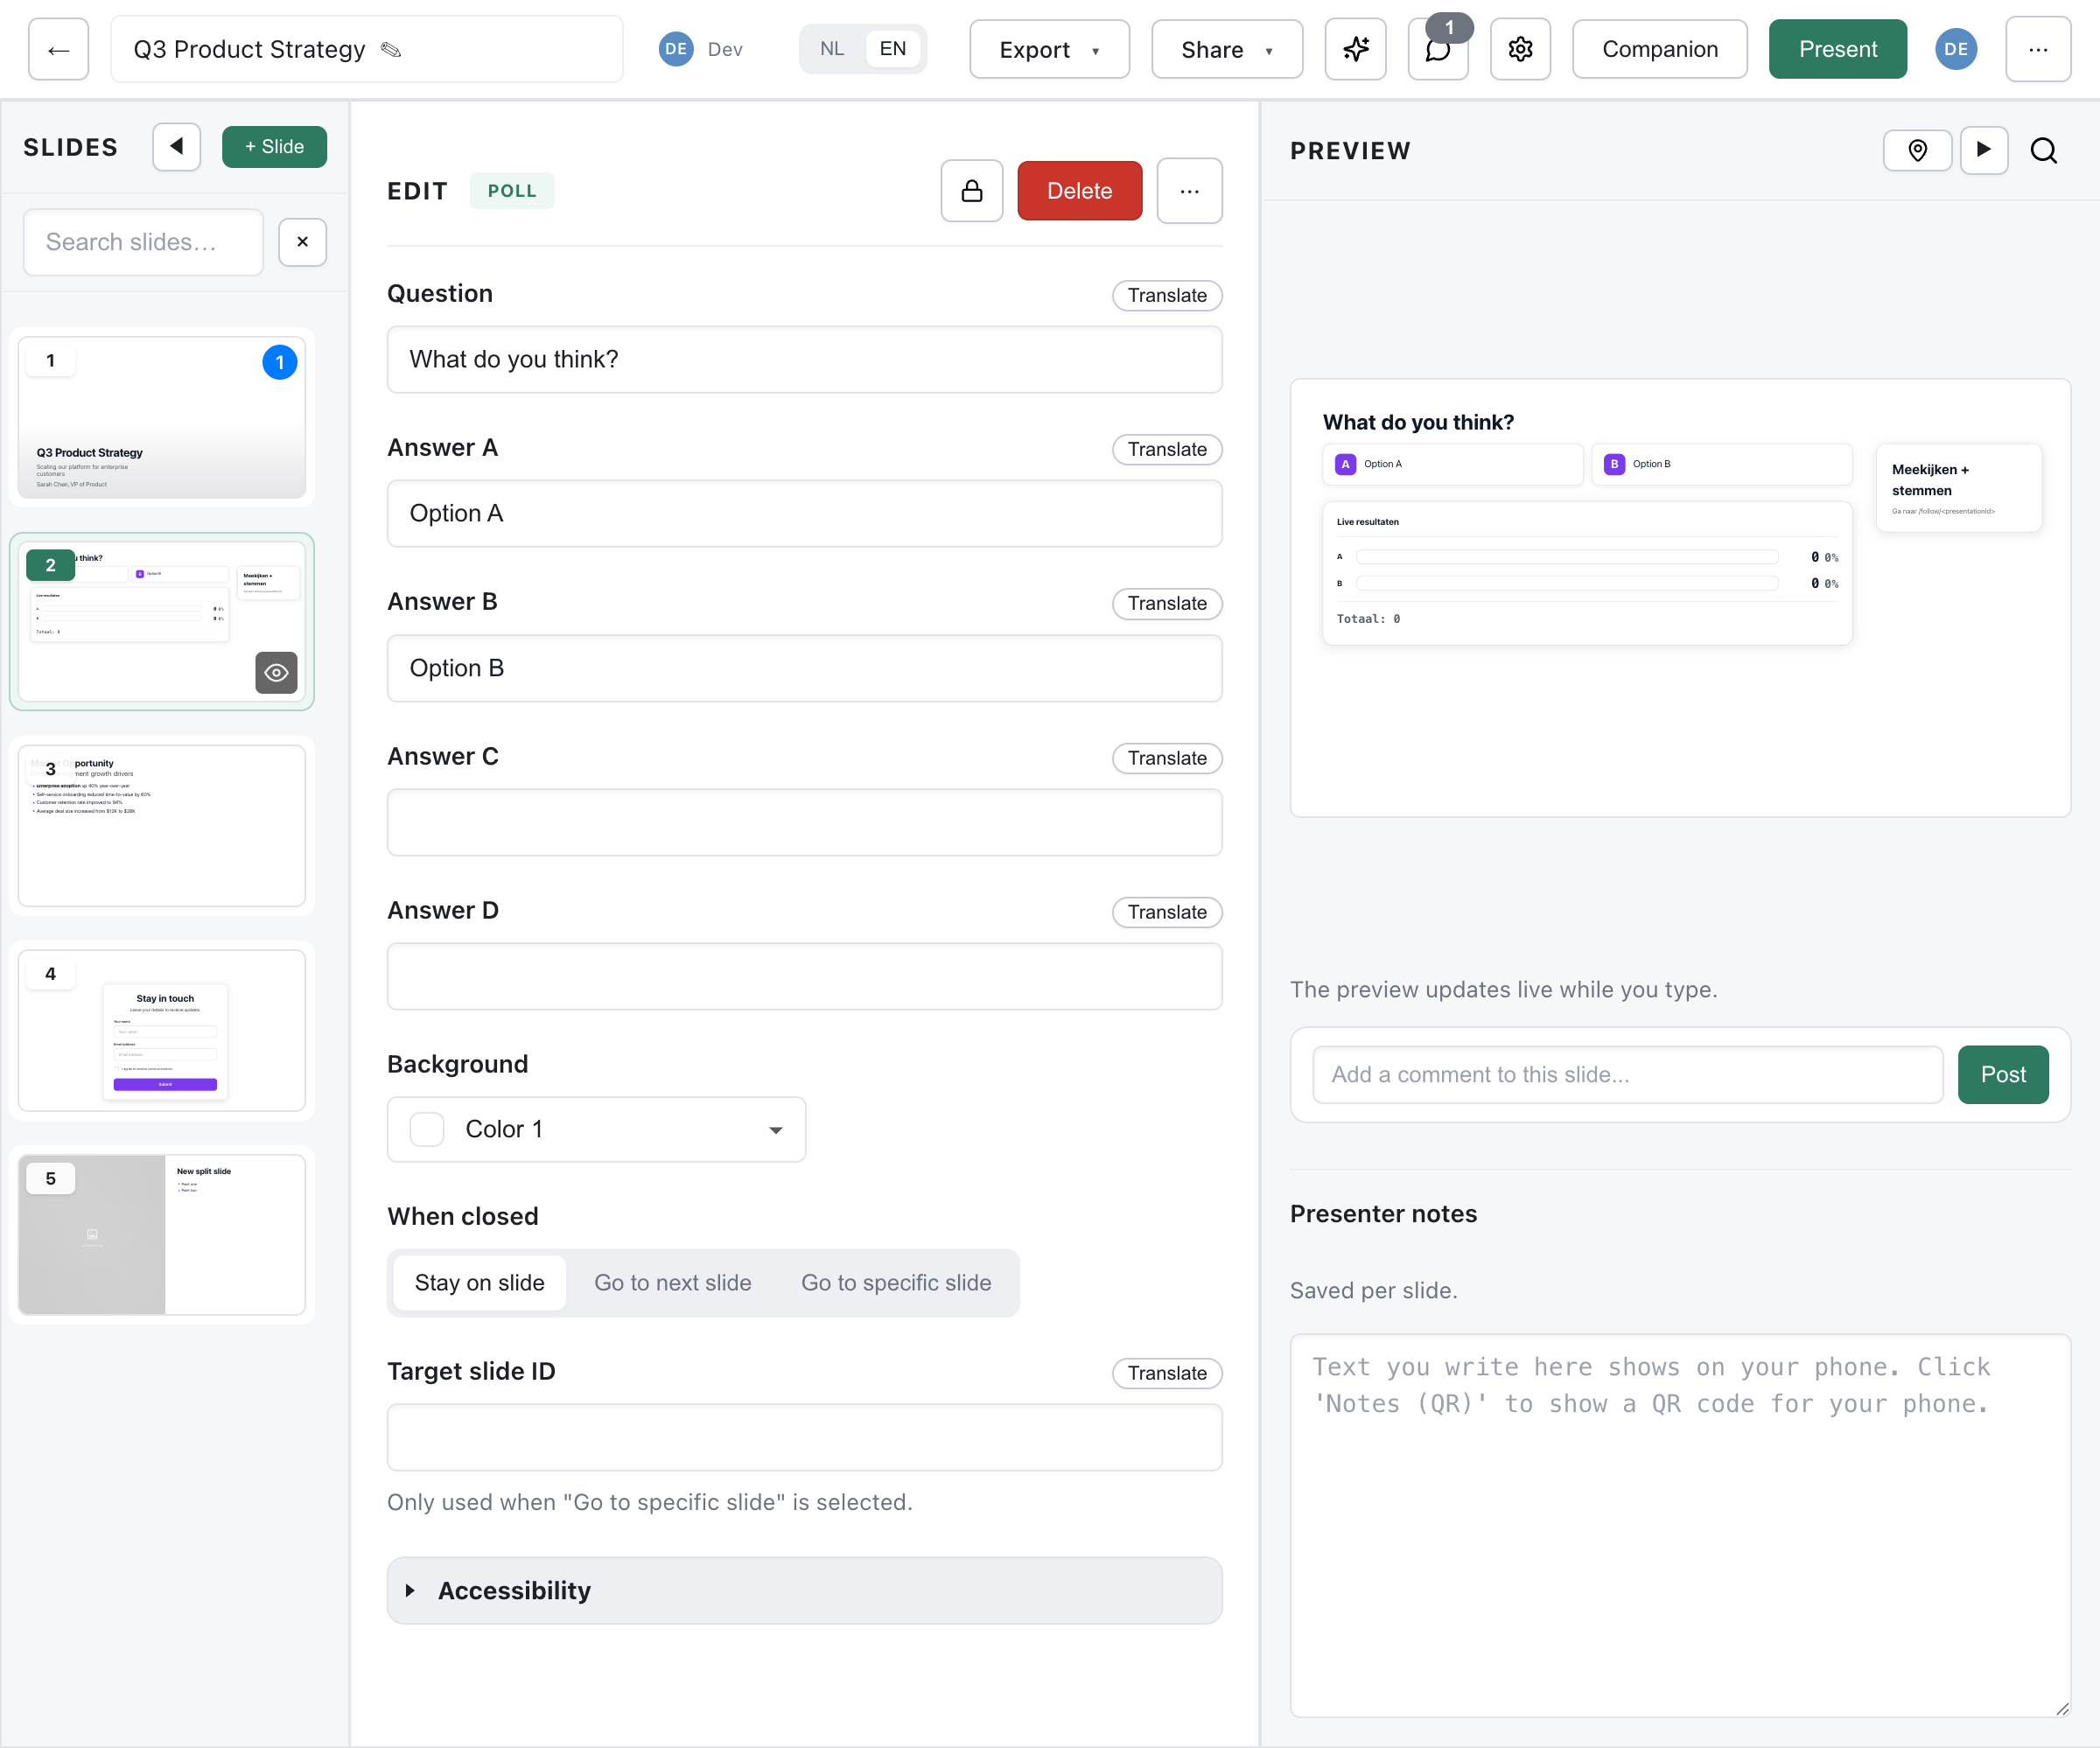
Poll Fields
Section titled “Poll Fields”| Field | Description |
|---|---|
| Question | Plain text, up to 200 characters. Required. |
| Answers | 2 to 4 answers, each up to 120 characters. They are lettered A to D. |
| Background | Lime or Mist |
| When closed | Stay on slide, Go to next slide or Go to specific slide |
| Target slide ID | The slide to go to, when When closed is set to a specific slide |
A new poll starts with the question “What do you think?” and two answers.
Likert Fields
Section titled “Likert Fields”A Likert slide has a question, 2 to 10 Scale labels in order, a background and the same When closed setting. It starts as a five-point scale from “Strongly disagree” to “Strongly agree”.
Likert Slider Fields
Section titled “Likert Slider Fields”A Likert slider has a statement, a label for the left end (1) and one for the right end (10), and a background. The scale is always 1 to 10. It has no When closed setting.
What the Slide Shows
Section titled “What the Slide Shows”A Poll slide shows the question, the answers and a “Follow along + vote” panel with the join code, so people who have not joined yet can still do so. Likert slides don’t carry that panel; put a Follow invite slide before them if your audience has not joined yet.
Running a Poll
Section titled “Running a Poll”Opening
Section titled “Opening”Voting opens by itself when you reach the slide in a live session. In the presenter view, the interaction controls show a status such as “Poll: open · 24 votes”.
Voting
Section titled “Voting”On their phone, followers see the question with a button per answer (or a slider), and “Vote now.” After voting they see “Thanks! Your vote was saved.”
- One vote per device. Voting again replaces the earlier vote.
- Only the current slide. The audience can vote on the slide you are showing, not on earlier or later ones.
- Q&A steps aside. While a voting slide is on screen, the Q&A panel is hidden for the audience.
Results
Section titled “Results”Results are always live. The bars or the curve on the slide update as votes come in, together with the total. On their phone, the audience sees their own vote, not the totals.
There is no option to hide results until voting ends.
Closing and Resetting
Section titled “Closing and Resetting”The presenter view has three controls:
- Close - stop voting. Followers see “Voting is closed.”
- Open - reopen a closed poll
- Reset - delete all votes on this slide, after a confirmation. The poll stays open or closed.
Only people who can control the presentation can use them. Closing is always manual; there is no timer.
When you close a Poll or Likert slide whose When closed is set to Go to next slide or Go to specific slide, the presentation moves on by itself.
Privacy
Section titled “Privacy”Votes are anonymous. They are not linked to a user account, name or email address. Each vote is tied to a random device identifier, kept in a cookie for 90 days, so a device can change its vote but not vote twice.
How Long Results Are Kept
Section titled “How Long Results Are Kept”Votes belong to the live session:
- When the session is closed, its votes are deleted
- A session that has been idle for more than 24 hours is closed automatically
Poll results are not stored in analytics and cannot be exported. To keep them, take a screenshot of the results or use the webhook below.
Webhooks
Section titled “Webhooks”Closing a poll can notify another system. An admin can set a URL for:
interaction.poll_closed- a Poll slide was closedinteraction.likert_closed- a Likert or Likert slider slide was closed
The webhook fires when a slide goes from open to closed. Its payload includes the totals per answer. See Webhooks.
- Keep the question short, so people can read it from the back of the room
- Make the answers clearly different from each other
- Give people time to scan the code and vote before you close
- Use Go to next slide on close to move straight to your discussion