

Feedback
Ask your audience an open question and collect their written answers from their phones.
Overview
Section titled “Overview”A feedback slide puts one open question on screen with a QR code. While your session is live, the audience scans the code, joins in follow mode and types an answer. You see how many answers came in and download them as a file.
Feedback is free text only. For ratings, scales or multiple choice, use a poll or a Likert slide.
Creating a Feedback Slide
Section titled “Creating a Feedback Slide”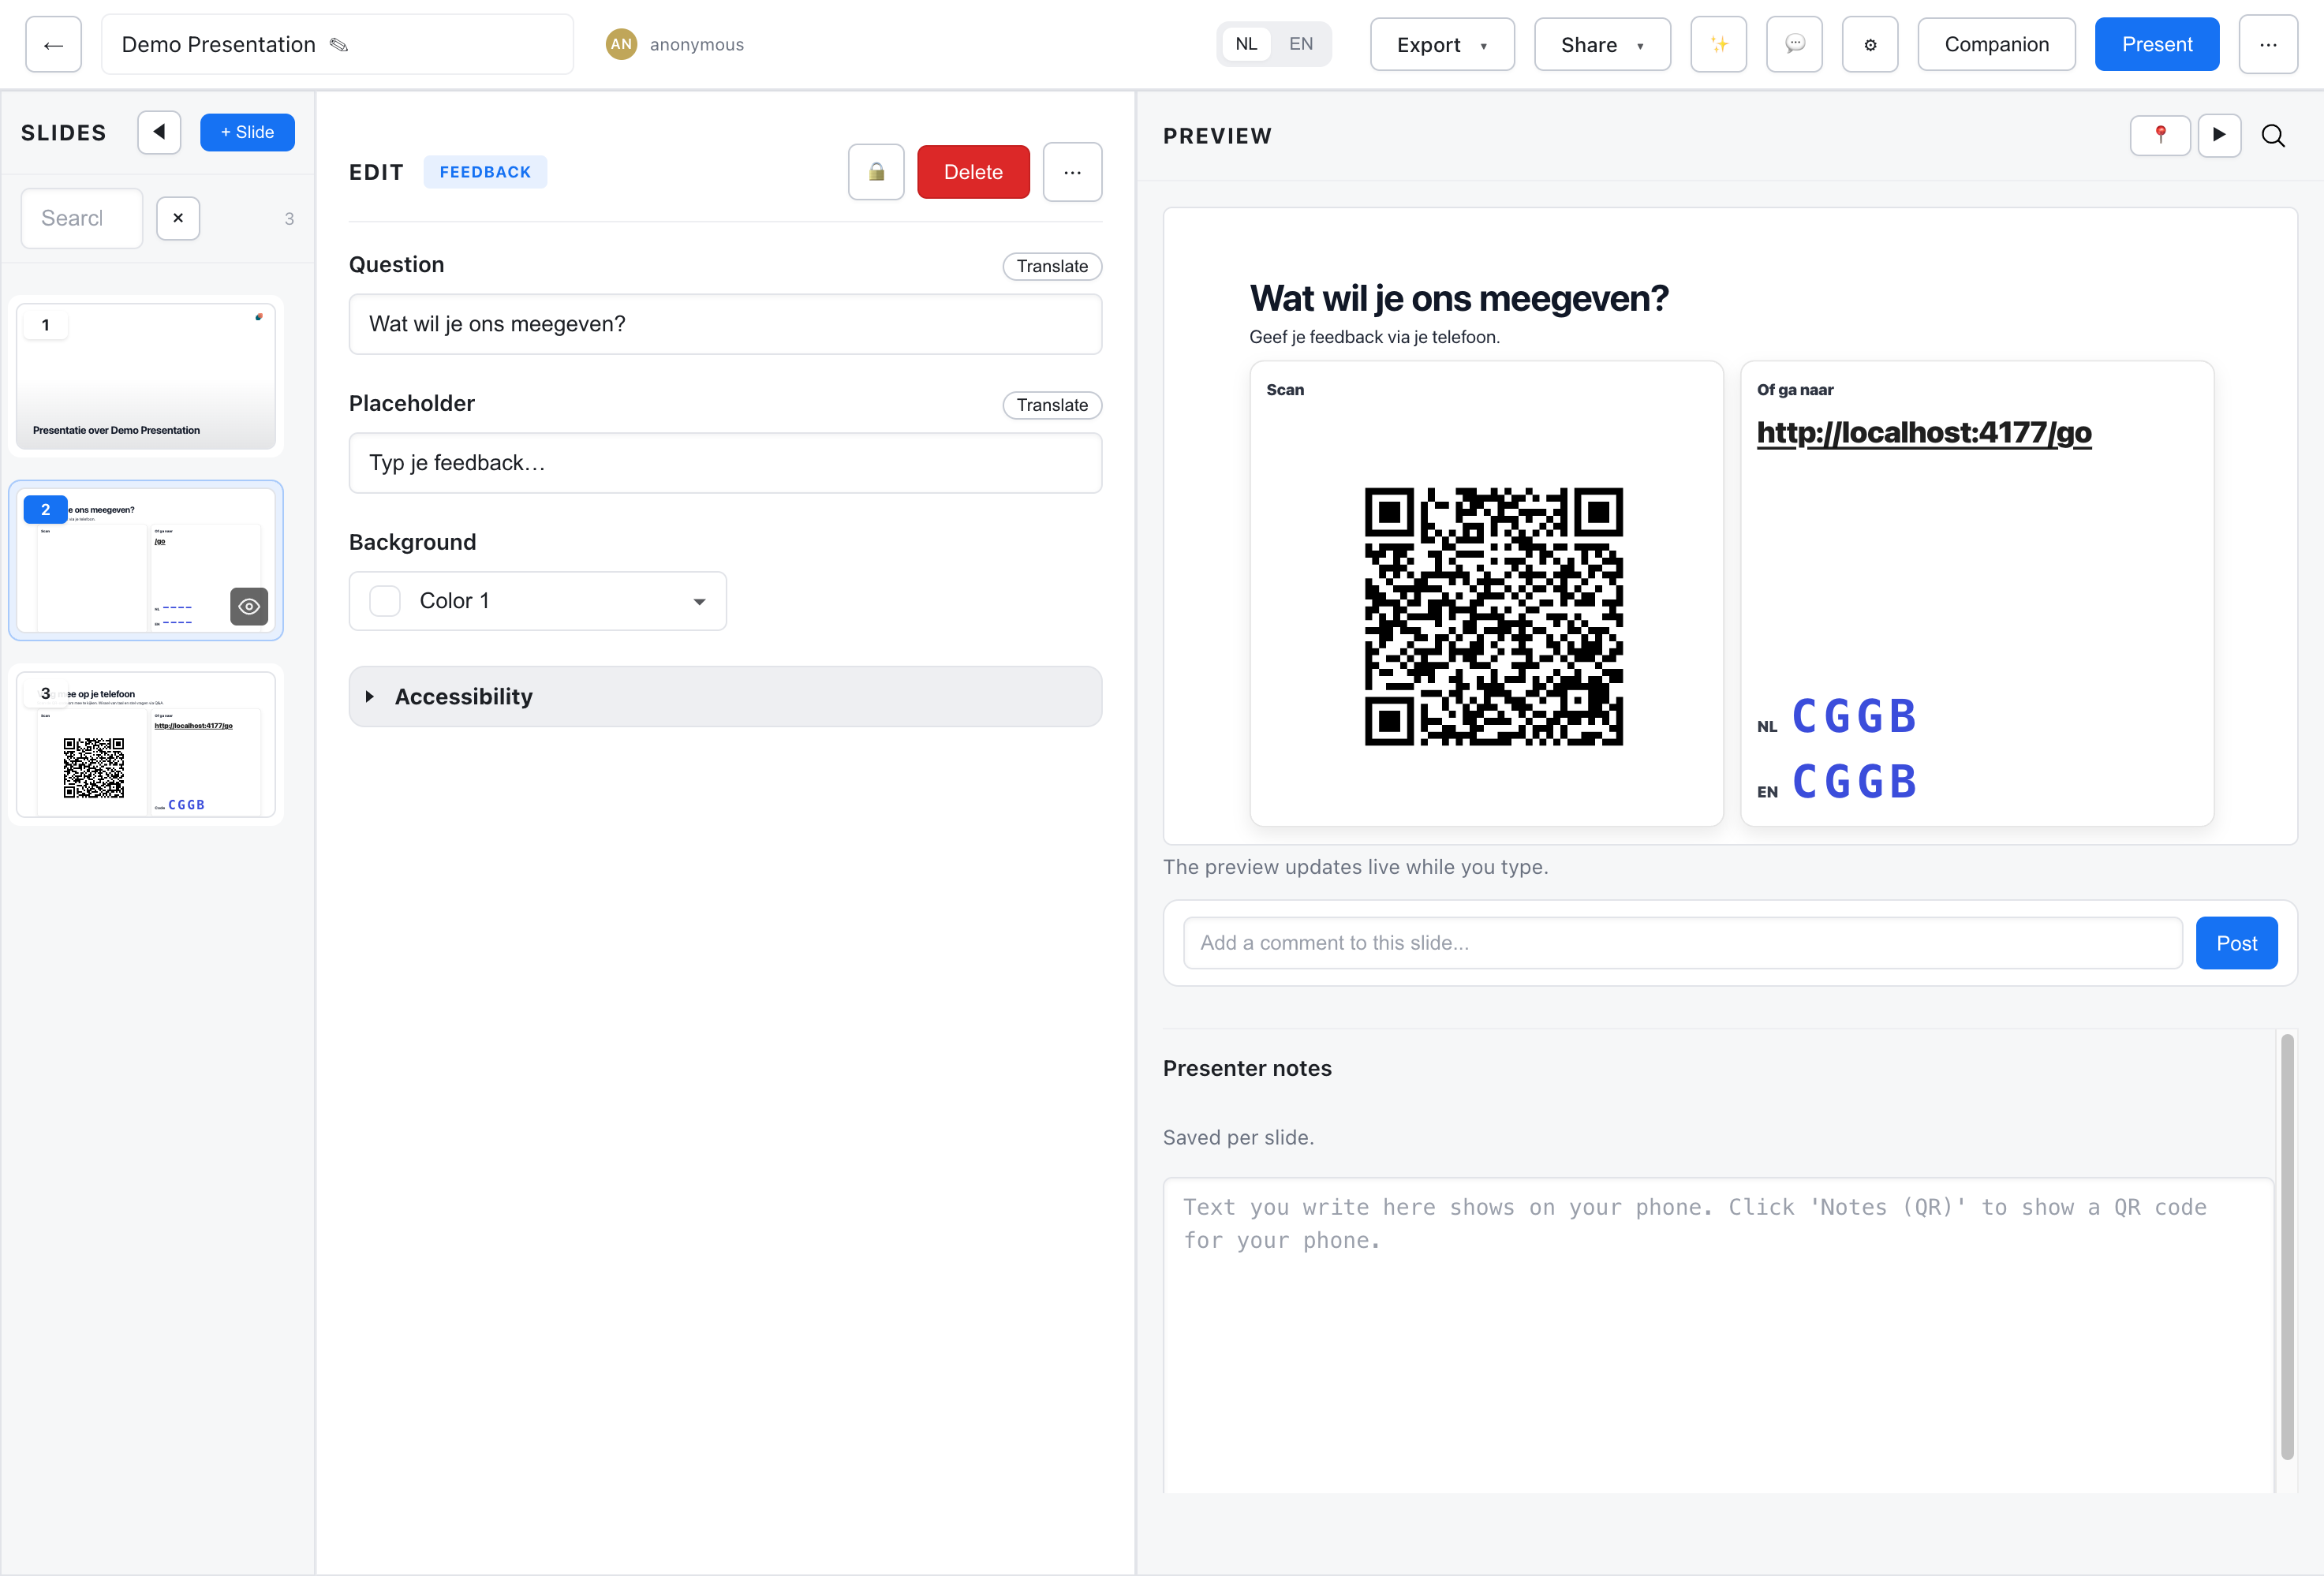
- Click Add Slide
- Select Feedback from the Interaction category
- Type your question on the slide
- Set the placeholder and background in the inspector
Fields
Section titled “Fields”| Field | Description |
|---|---|
| Question | The question on the slide, up to 200 characters. Required. |
| Placeholder | Hint text in the audience’s answer box, up to 120 characters |
| Background | Lime or Mist |
A new slide starts with the question “Any feedback for us?” and the placeholder “Type your feedback…”.
What the Slide Shows
Section titled “What the Slide Shows”The slide shows your question, the line “Give your feedback via your phone.”, a QR code to follow along, and the short /go access code for each language version of the presentation. Answers are never shown on the slide.
Collecting Feedback
Section titled “Collecting Feedback”The Audience
Section titled “The Audience”When you reach the feedback slide in a live session, followers see an answer box on their phone:
- Type an answer (up to 4,000 characters)
- Press Send (after the first answer, the button reads Update)
- See “Thanks! Your feedback was saved.”
Each device gives one answer per feedback slide. Sending again replaces the earlier answer, so people can edit what they wrote while collection is open.
Answers are only accepted while the session is live and the feedback slide is the current slide.
The Presenter
Section titled “The Presenter”In the presenter view, the interaction controls for a feedback slide show a status line, for example “Feedback: open · 12 responses”. From there you can:
- Open or Close collection for this slide
- Reset to delete every answer on this slide
- Download the answers as CSV
The response count updates live. The answers themselves are not shown during the presentation.
Downloading Answers
Section titled “Downloading Answers”Download saves feedback-<slideId>.csv with one row per answer:
| Column | Content |
|---|---|
slideId | The feedback slide |
deviceId | A random identifier for the answering device |
createdAt | When the answer was first sent |
updatedAt | When it was last changed |
text | The answer |
The question itself is not in the file. The same data is also available as JSON by changing the extension of the download URL to .json.
Download the answers before the session ends. See How Long Answers Are Kept.
Privacy
Section titled “Privacy”Feedback does not ask for a name or email address, and none is stored. Each answer is linked to a random device identifier, kept in a cookie for 90 days, so a device can update its own answer. That identifier is included in the download.
Answers are free text, so people can still write personal details into them. Treat the download accordingly.
How Long Answers Are Kept
Section titled “How Long Answers Are Kept”Answers belong to the live session:
- When the session is closed, its answers are deleted
- A session that has been idle for more than 24 hours is closed automatically
- Reset deletes a slide’s answers straight away
This is not configurable. There is no feedback history in analytics, so the download is the only way to keep the answers.
Webhook
Section titled “Webhook”Each submitted answer fires the interaction.feedback_submitted webhook, if you have configured a URL for it. See Webhooks.
- Ask one clear, open question
- Put the feedback slide near the end, and leave time to answer
- Tell people you won’t see their names
- Download the CSV before you close the session